VERDICTS Live Video Capture

|

|
VERDICTS thread view demo showing quickly zooming into method call patterns.
| Demonstrating how VERDICTS captures and shows method calls in a test program, CircleSurround.
|
VERDICTS Screenshots
These screenshots can give you a quick overview of some of the most useful VERDICTS visualizations.
Screenshots are followed by
VERDICTS description,
motivation
(maintainability and
software reuse)
and earlier screenshots.

Apache Ant, detail
(dynamic analysis)

Apache Ant
(dynamic analysis)
JUnit
(dynamic analysis)

VERDICTS analysis
of VERDICTS
Statistics for I/O values,
BoxPlot, Corr. Matrix

X-Y Plot
with Circle-Surround

Method contract and user-defined probe vars

Statistics with user-
defined probe vars
|
|
|
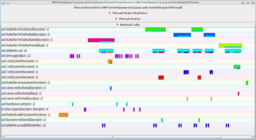
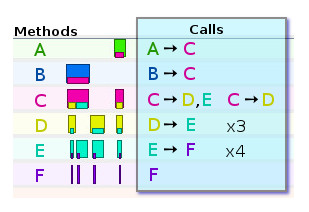
VERDICTS Analysis of Apache Ant, Detail
Detail from analysis of Apache Ant, showing method interaction patterns in VERDICTS style colored box-in-box views. Each big box is a method call, each box within it is a call made from that method call (to another method of interest). This is our novel visualization for method call interactions that reveal significant repeated patterns and changes in patterns of behavior. The image below shows how this view works.
|
|
|

|
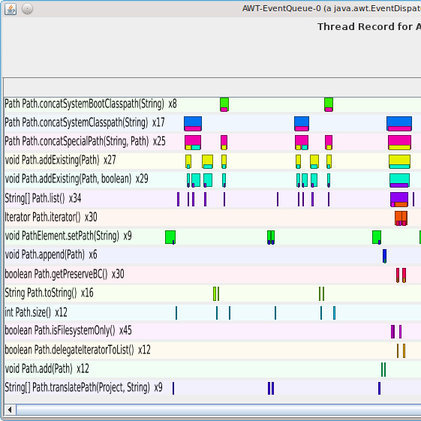
VERDICTS Analysis of Apache Ant
VERDICTS visualization showing method call interactions in Apache Ant, using box-in-box views to reveal patterns of behavior. VERDICTS allows quickly zooming in and out to reveal smaller and larger patterns in this view.
|
|
|

|
VERDICTS Analysis of JUnit
VERDICTS visualization from analysis of JUnit, showing inter-method relationships using VERDICTS' own box-in-box views.
|

|
VERDICTS Analysis of VERDICTS
This diagram shows patterns of behavior visible in analysis of a portion of VERDICTS code base. Box-in-box views show caller-callee relationships as before.
|
|
|

|
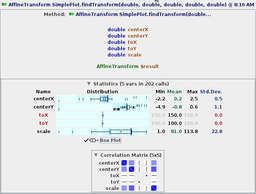
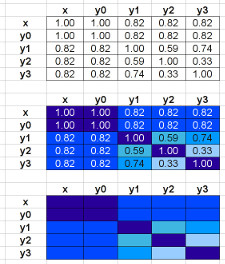
VERDICTS Aggregate View: Statistics of Method Arguments
This VERDICTS view shows full range and habitual range of method call in/out values using boxplots, density gradient background, and outliers marked with tick marks. User-defined probe variables can be added. Nonvariables (std dev = 0) are highlighted in red.
Correlation matrix: Darker boxes have higher correlation, negative correlation would be shown with red square around box. Clicking on any box brings up that X-Y plot. Nonvariables cause degenerate X-Y plots of vertical/horizontal line or single point, as highlighted in the correlation matrix view.
| Box Plot & Distribution Density | Correlation Matrix
|
|---|

|
|

|
|
|
|

|
VERDICTS X-Y Plot with Circle-Surround Visualization
Plots between two variables (method in/out variables and user-defined probe/contract variables) can be viewed as standard plots, or can be made to quickly reveal overlapping values by using a visual slider as shown here. Our novel Circle-Surround view compactly shows repeated values in a way that can be quickly grasped as well as hovered and clicked to reveal information about the corresponding method call. Here's an example of circle-surround view with 516 overlapping points (passing contracts) from VERDICTS analysis of a portion of the Apache Commons Collection:

|
|
|
|
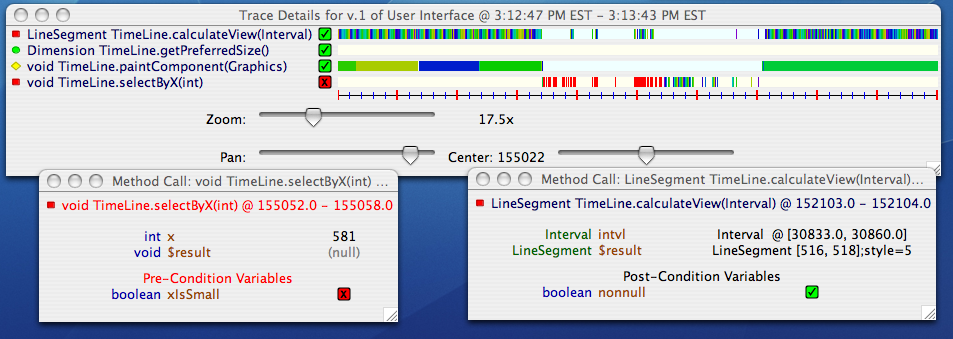
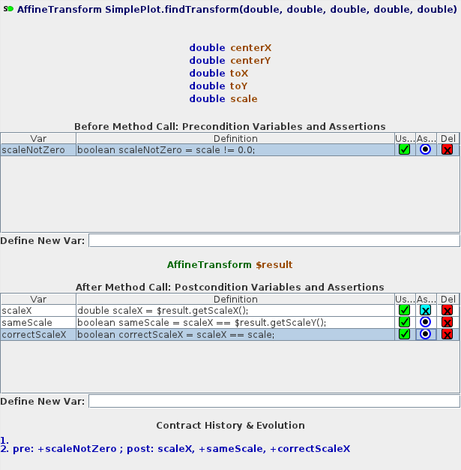
VERDICTS Contract, User-Defined Probe Variables
A method contract is made up of in/out arguments for the method and user-defined probe variables with Java expression definitions as seen above (added without restarting target program). All variables (in, pre, $result, post) are tracked for statistical analysis using box-plots and correlation matrix, and can also be plotted against each other using X-Y plot. To create a method contract, any boolean variable can be asserted (blue target icon) to be always true.
|
|
|
|
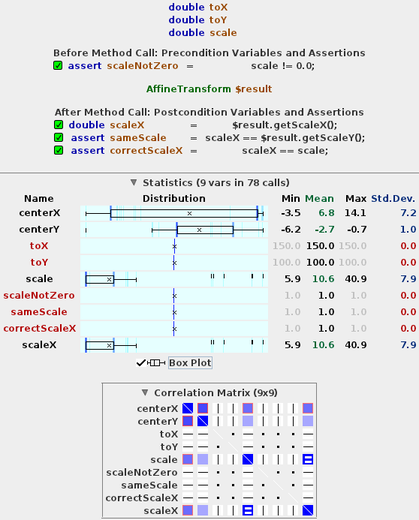
VERDICTS Contract Statistics
Another statistics screenshot showing arguments, user-defined pre- and post-variables, box plots, range, and correlation matrix. Here, correlation matrix also has "=" icons, where two variables are always equal in value (in all method calls for this method). Boolean constant values in red (always 1.0 = True) are as we had expected. Negative correlations are shown with red box outline.
|
VERDICTS Introduction
Visual Exploratory Requirements Discovery and Injection
for Comprehension and Testing of Software
VERDICTS is a technique and prototype tool to demonstrate a new approach to combining software
comprehension and testing by visualization and incremental discovery and addition of
requirements to existing software.
- Automated: Requirements are used to automate erroneous behavior detection.
- Visual: Visualization is used to aid comprehension by providing abundant
information in a form that makes it easier to detect common patterns.
- Live: In one session, new requirements can be discovered, injected into
the software, verified (checked against the behavior of the program),
and modified without recompilation or restarting the program under test.
VERDICTS gathers live program execution data and interacts with the
target program to help developers analyze the aggregate behavior by viewing,
statistically analyzing, and testing multiple calls to each function traced.
In our quantitative comparisons, using VERDICTS significantly speeds up
analysis of patterns of behavior as compared to a modern IDE (Eclipse),
mainly through box-in-box views of method call interactions and patterns.
My full PhD thesis is available online here (262 pages).
Maintainability: Software That Satisfies Customers, But Frustrates Developers
Even when software performs to the satisfaction of many customers,
it may have been developed with bad software engineering practices
that produce unmaintainable (often incomprehensible) software.
Unfortunately this happens more often than we would like to admit,
because cutting corners is efficient in the beginning, by skipping
large-scale analysis, design and documentation and jumping straight into
writing code. As there is no big-picture view of the system, new developers
cannot easily comprehend software as a whole, due to:
- poor/no specifications
- poor/no documentation
- quick-and-dirty architecture
- non-uniform design
- non-uniform implementation strategies for common problems
- unreadable code (cryptic names, missing in-code comments, confusing/no code style)
- much repeated/similar code
- few/no tests
For such software, a software comprehension and specification/feature
discovery session may have to precede any type of maintenance task.
Software Reuse
Making a part of software reusable, ideally by compiling
many related reusable functions into a library, requires much effort,
especially to test these functions thoroughly to make them more generally
applicable, as would be required of a reusable software component.
Opportunistic Software Reuse refers to reuse of parts of software that were not
designed or documented for the purpose of reuse.
If you are working on an open-source project, you can reuse parts of other
open source projects available on the internet, using public code search
engines such as
Koders
and Google Code Search.
For proprietary software development, you may have access to a large company
code base, which may again be accessible through enterprise versions of
code search engines.
As there is no universal specification language, these code search engines
do text-search in source code, which often retrieves many false positive
source code files.
Similar to exploratory testing ideas, VERDICTS allows exploratory discovery
of how a software component operates. A VERDICTS session allows the developer
to better understand the software component while generating a reusable
specification for the component. Actually, evolving the specification is how
the developer tests different ideas about the operation of the component.
VERDICTS can generate unit tests based on
the discovered specifications and
trace data collected in the VERDICTS session.
The unit tests (which contain specific component input data),
and the more generally applicable specifications
represent both human-readable documentation of component behavior as well as
executable tests to verify component correctness.
Earlier Screenshots
Note: These screenshots are from an earlier version of VERDICTS. New
version has more information-rich versions of these visualizations
as well as new visualizations such as those on top of this page.
Contracts, User-Defined Observables
Pre-conditions and post-conditions for methods can be created and modified while the target program
is running. These define method contract, what is expected from this method.
Interactive live contract-setting allows new paradigms. The contract may represent:
- A permanent contract stating how this method should always behave.
- A temporary contract to test behavior by setting context-specific expectations.
(for example, while the tax-exempt checkbox is checked, we may expect calculateTax method to never be called)
- A temporary contract used to discover how the program actually behaves (rather than stating how it should behave).
This approach uses contracts for comprehension rather than specification.
In the screenshot below, blue-black target icons represent contracts. Each line represents an observable,
a user-defined variable within the context of the method call.

Tracing Session, Pass/Fail
For each tracing session, the user selects the methods to be traced, starts the session (starts recording),
interacts with the target program (without having to ever stop the program), and stops the session.
Then, all the method calls, their arguments (as well as return type and contract-specific user-defined observables),
and whether they passed or failed the expectations set by the
contracts can be viewed as seen here.

Aggregate Indicators: Statistics, Plots
Aggregate behavior of methods can be observed by looking at correlations between the observables (arguments,
return type and user defined variables that are of primitive type) as well as plots between pairs of observables.
The patterns observed suggest new contracts that can be declared either to tighten specifications or to create hypotheses
to better understand actual program behavior.

This research was conducted at the Syracuse University DOPL lab supervised by
Dr. James W. Fawcett.